Dye-Sensitized Solar Cells
Two N719/TiO₂ dye-sensitized solar cells, identical except for the counter electrode: candle soot on one, pencil graphite on the other. The soot cell produced about 17 times the light response of the graphite cell and a measured efficiency of 0.0113%; the graphite cell was shorted by leakage. A team lab for Olin materials science.

Overview
A dye-sensitized solar cell (DSSC) is a sandwich of two glass electrodes. On one side, a porous TiO₂ film soaked in dye absorbs light; on the other, a counter electrode keeps the cell’s electrolyte cycling. We built two cells that were identical except for that counter electrode, candle soot versus pencil graphite, and compared how well each one turned light into current.
This was a team lab with Aryan Banerjee, Ben Rha and Zahra Lari (Team BIZA) for Olin’s materials science course. We shared fabrication, testing and analysis.
Results:
- At zero bias, light changed the soot cell’s current by 1.94 µA, against 0.12 µA for the graphite cell: about 17× the response.
- The soot cell reached a best sampled output of 2.19 µW at 0.686 V, an efficiency of 0.0113% from 19.5 mW of incident light.
- The graphite cell produced no usable power. Its dark current fit a 239 Ω resistor almost perfectly (R² = 0.993), which points to leakage or a partial short across the cell.
- SEM showed a crack network through the TiO₂ film, a likely limit on how much of the film did useful work.
How the Cell Works
The stack, from front to back:
- FTO glass: transparent, conductive front electrode
- TiO₂ + N719 dye: sintered porous film, sensitized with dye
- I⁻ / I₃⁻ electrolyte
- Carbon counter electrode: soot or graphite
- FTO glass: back electrode
When the dye absorbs a photon, it injects an electron into the TiO₂. The electron travels through the FTO and the external circuit to the counter electrode, where the carbon reduces I₃⁻ to I⁻. The I⁻ then regenerates the oxidized dye, closing the loop. The counter electrode’s job is to make that reduction step fast; if it is slow, or if it touches the photoanode, the cell loses current.
Fabrication
Photoanode (both cells):
- Wiped TiO₂ paste onto FTO glass.
- Sintered at 450 °C for 5 hours.
- Soaked the film in N719 dye until saturated.
Counter electrodes:
- Soot: coated FTO with candle soot.
- Graphite: coated FTO with pencil graphite, then baked at 300 °C for 15 minutes.
Assembly: added electrolyte between the electrodes and clamped the stack.
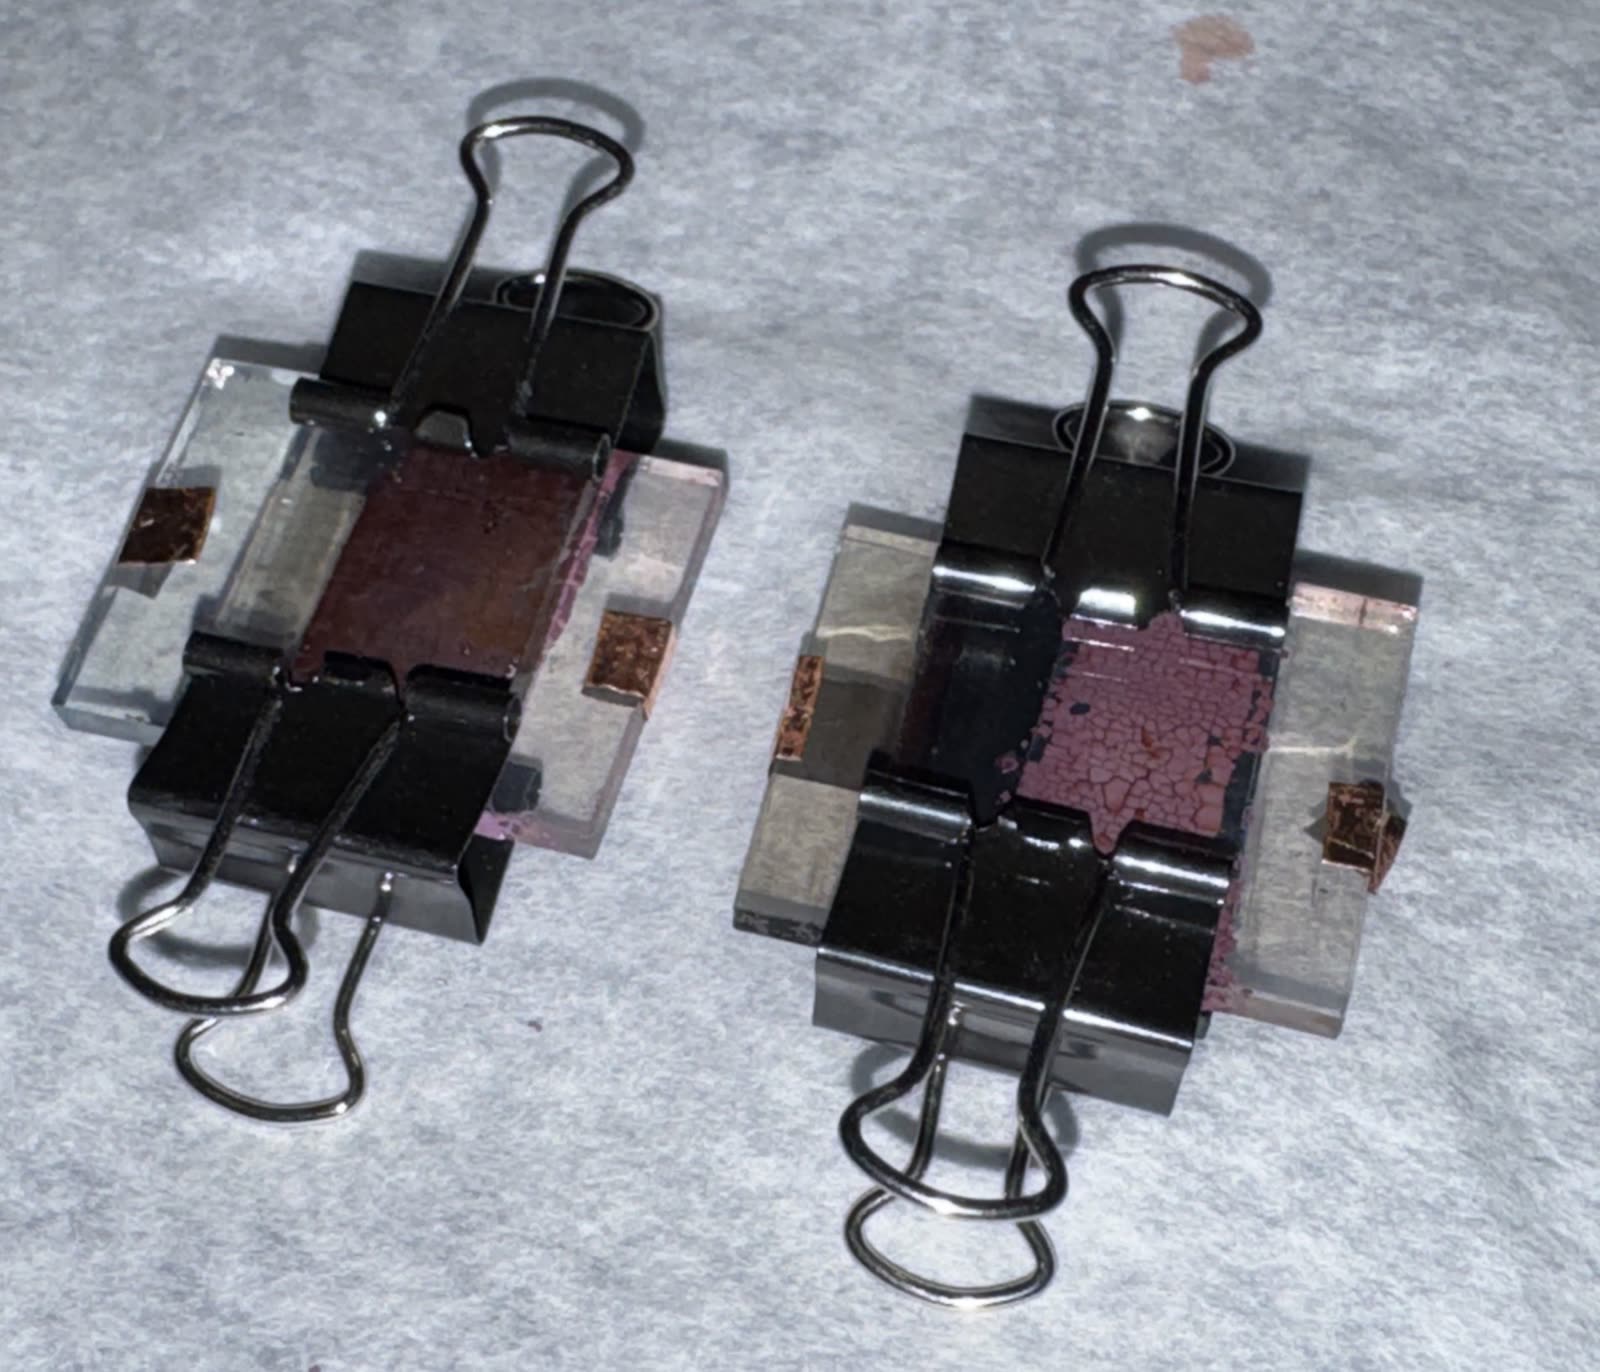
The finished cells: pencil graphite (left) and candle soot (right). Cracking in the soot cell’s TiO₂ film is visible by eye.
Film Characterization
Under SEM, the TiO₂ film was broken up by cracking, visible at both 35× (1 mm scale bar) and 2,500× (20 µm scale bar). Cracks reduce the area of film that is connected and doing useful work, and can weaken the film during assembly.
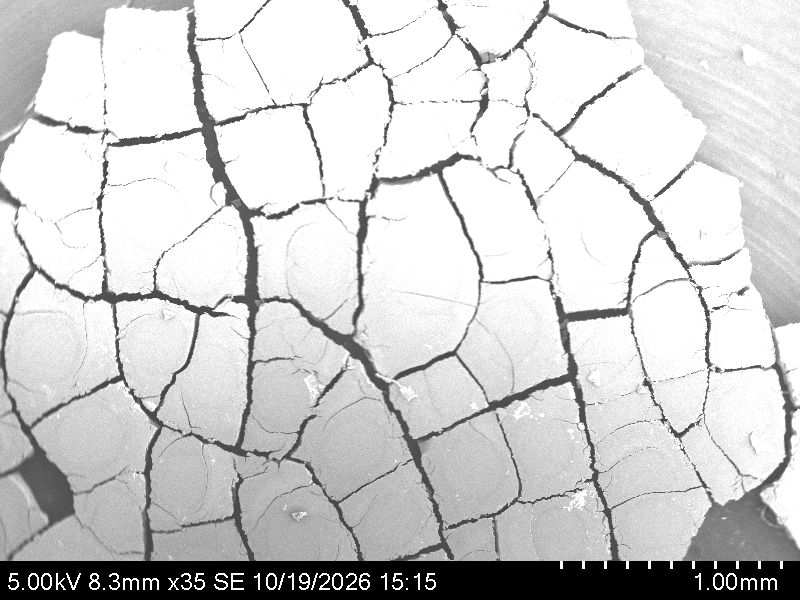
TiO₂ film under SEM at 35× (5 kV). The crack network runs across the whole field.
N719’s absorption has a visible peak around 540 nm (with another in the UV near 300 nm), which is why the cells respond across most of the visible band.
Electrical Testing
We swept voltage across each cell in the dark and under a lamp, measuring current at each step. Current density uses an approximate active area of 1.5 cm² per cell.
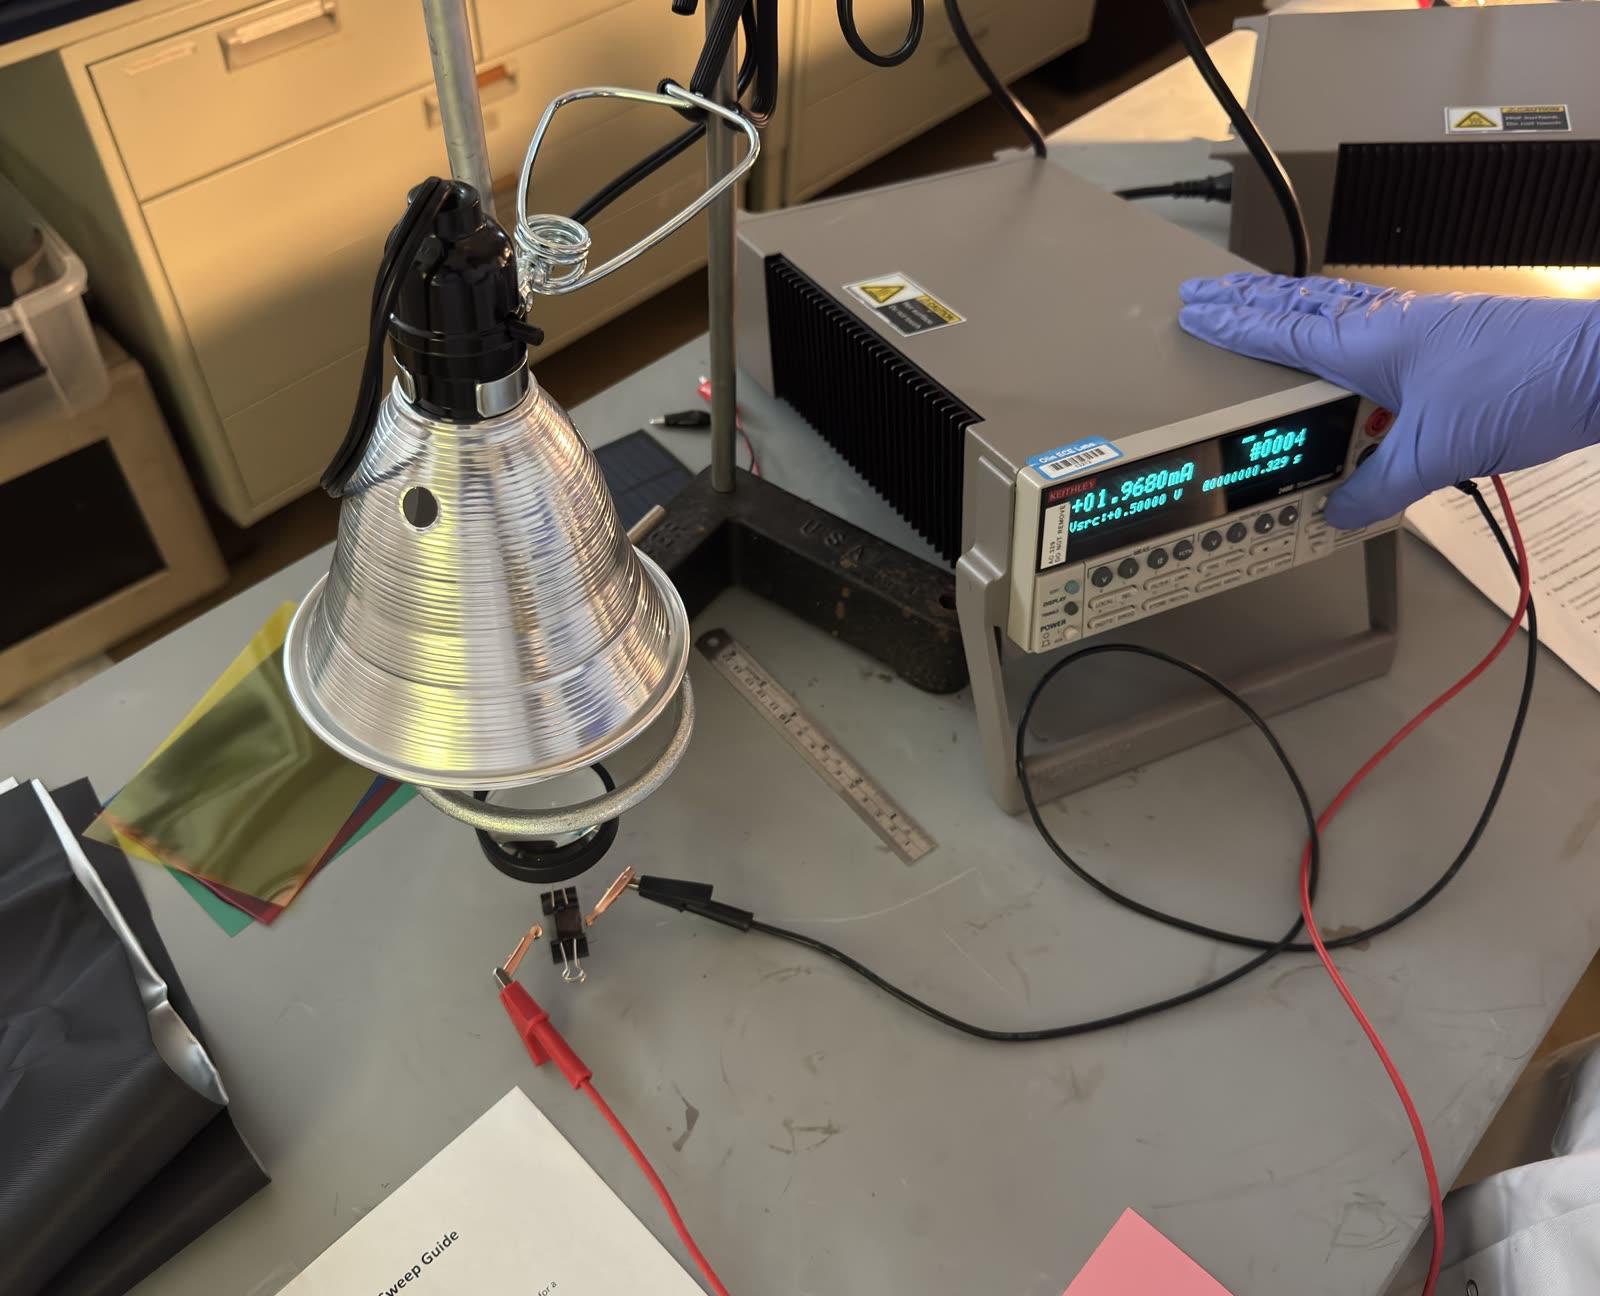
Test setup: lamp, color filters, the wired cell and the source meter.
At zero bias
| Carbon soot | Graphite | |
|---|---|---|
| Dark current | −0.00106 µA | −0.252 µA |
| Illuminated current | −1.937 µA | −0.369 µA |
| Light-induced change | 1.936 µA | 0.117 µA |
| Change in current density | 0.0129 A/m² | 0.000778 A/m² |
The soot cell barely conducts in the dark and responds strongly to light, which is what a working cell should do. The graphite cell already conducts a quarter of a microamp in the dark, and light adds comparatively little.
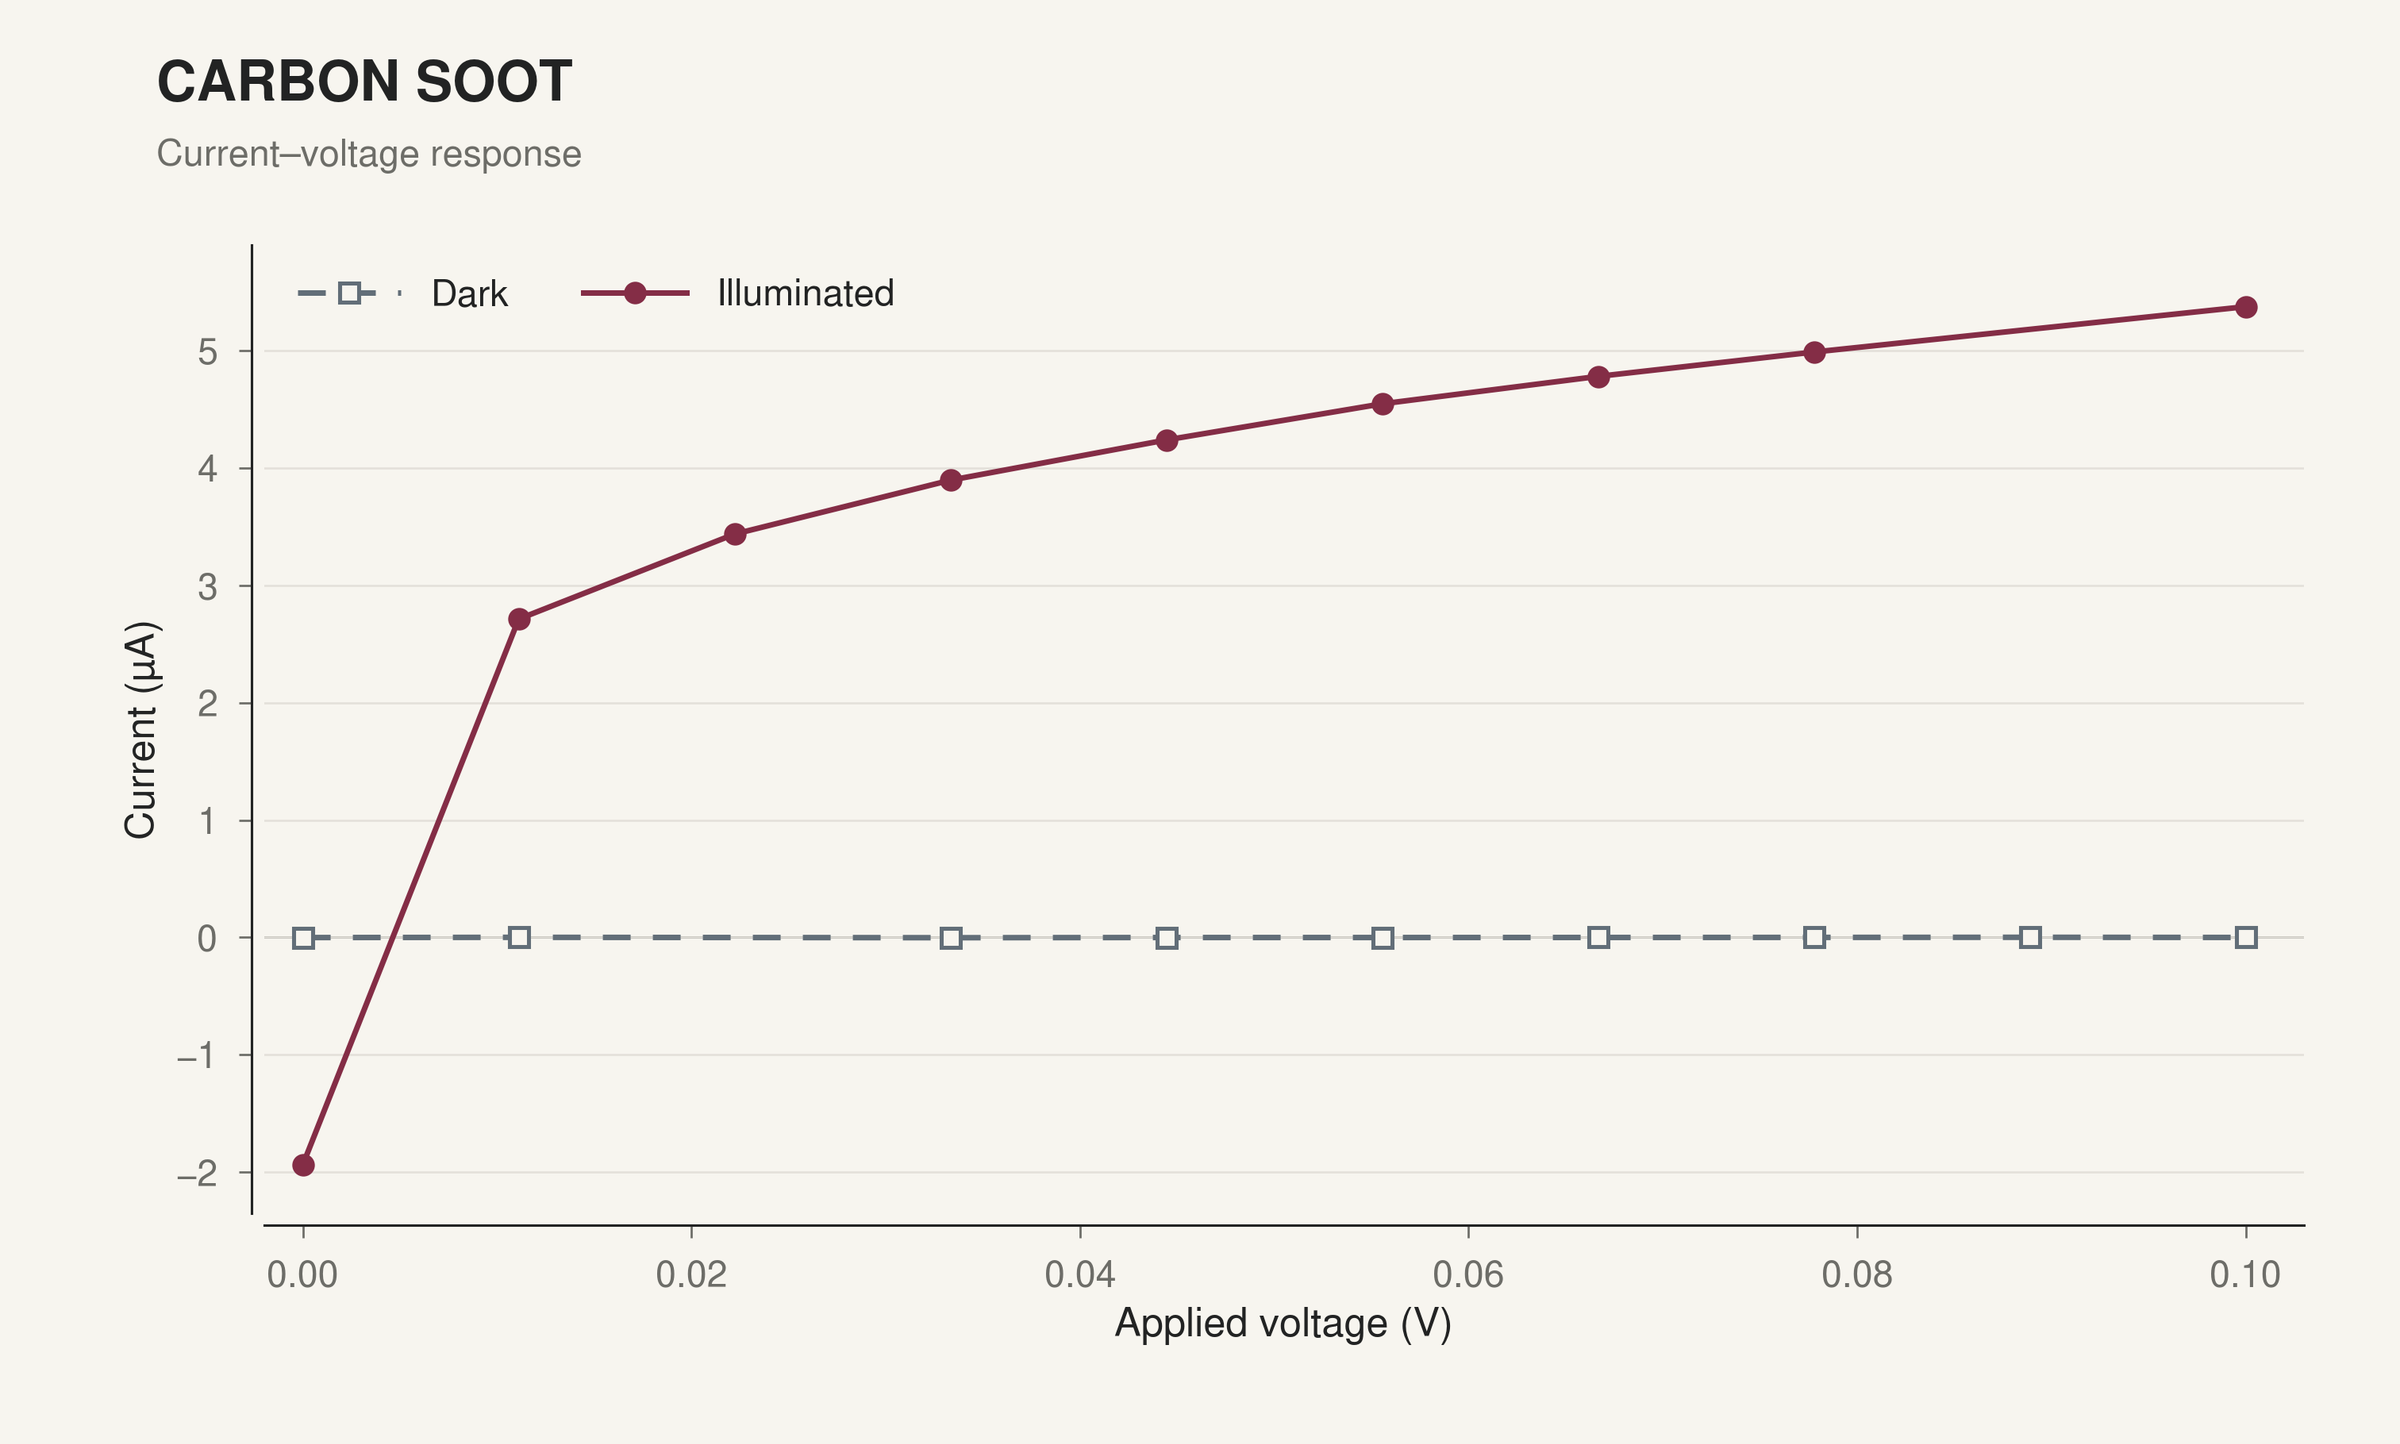
Soot cell, 0 to 0.1 V. Dark current stays near zero; under light the current crosses zero near 11 mV.
Resistance and efficiency
| Carbon soot | Graphite | |
|---|---|---|
| Shunt resistance (estimate) | ~2.39 kΩ | ~240 Ω (leakage) |
| Best sampled output | 2.19 µW at 0.686 V | 0 |
| Efficiency | 0.0113% | 0% |
Efficiency is the best sampled output power over the 19.5 mW incident on the cell. The soot cell’s shunt resistance is a proxy from its zero crossing: 11.11 mV over 4.65 µA. Series resistance couldn’t be resolved reliably for either cell.
The graphite cell’s dark sweep from 0.1 to 0.8 V fit a straight line with R² = 0.993 at 239 Ω. A healthy cell’s dark current is strongly nonlinear, not ohmic, so the graphite was most likely bridging to the photoanode or the contacts.
Spectral response (soot cell)
We repeated the soot measurement through blue, green, yellow and red filters. Current was about 8 µA under blue, green and red and about 7 µA under yellow, a nominal responsivity of 0.00036 to 0.00041 A/W against the unfiltered 19.5 mW. The dip under yellow may come from uneven lamp output in that band.
These filtered currents don’t line up with the earlier unfiltered zero-bias reading. The filter runs happened after a delay in the experiment, and by then the cell was heavily oxidized, so they aren’t comparable to the fresh-cell measurements. The spectral numbers need repeating on a fresh cell, with measured transmitted optical power.
What Went Wrong, and What We’d Change
The comparison was meant to be soot versus graphite as a catalyst. In practice it became a working cell versus a shorted one, so the 17× gap says more about cell construction than about the two carbons.
- Electrode isolation: add an electrolyte-compatible spacer, keep carbon off the contact pads, and clamp evenly.
- Film continuity: control TiO₂ coating thickness and drying, then check for cracks under SEM before assembly.
- Measurement: verify the active area and the optical power actually reaching the cell, test several cells per coating, and sample densely near zero bias. Our data also had rough edges: the soot dark fit was unstable (R² = 0.142 over nine readable points), one wide sweep showed an unexplained peak near 0.45 V, and a logged unit change from µA to mA partway through one graphite sweep.